Business Analytics
Measure what matters to you in real time. Powered by Power BI.

Real-Time Data for Real-Time Decisions
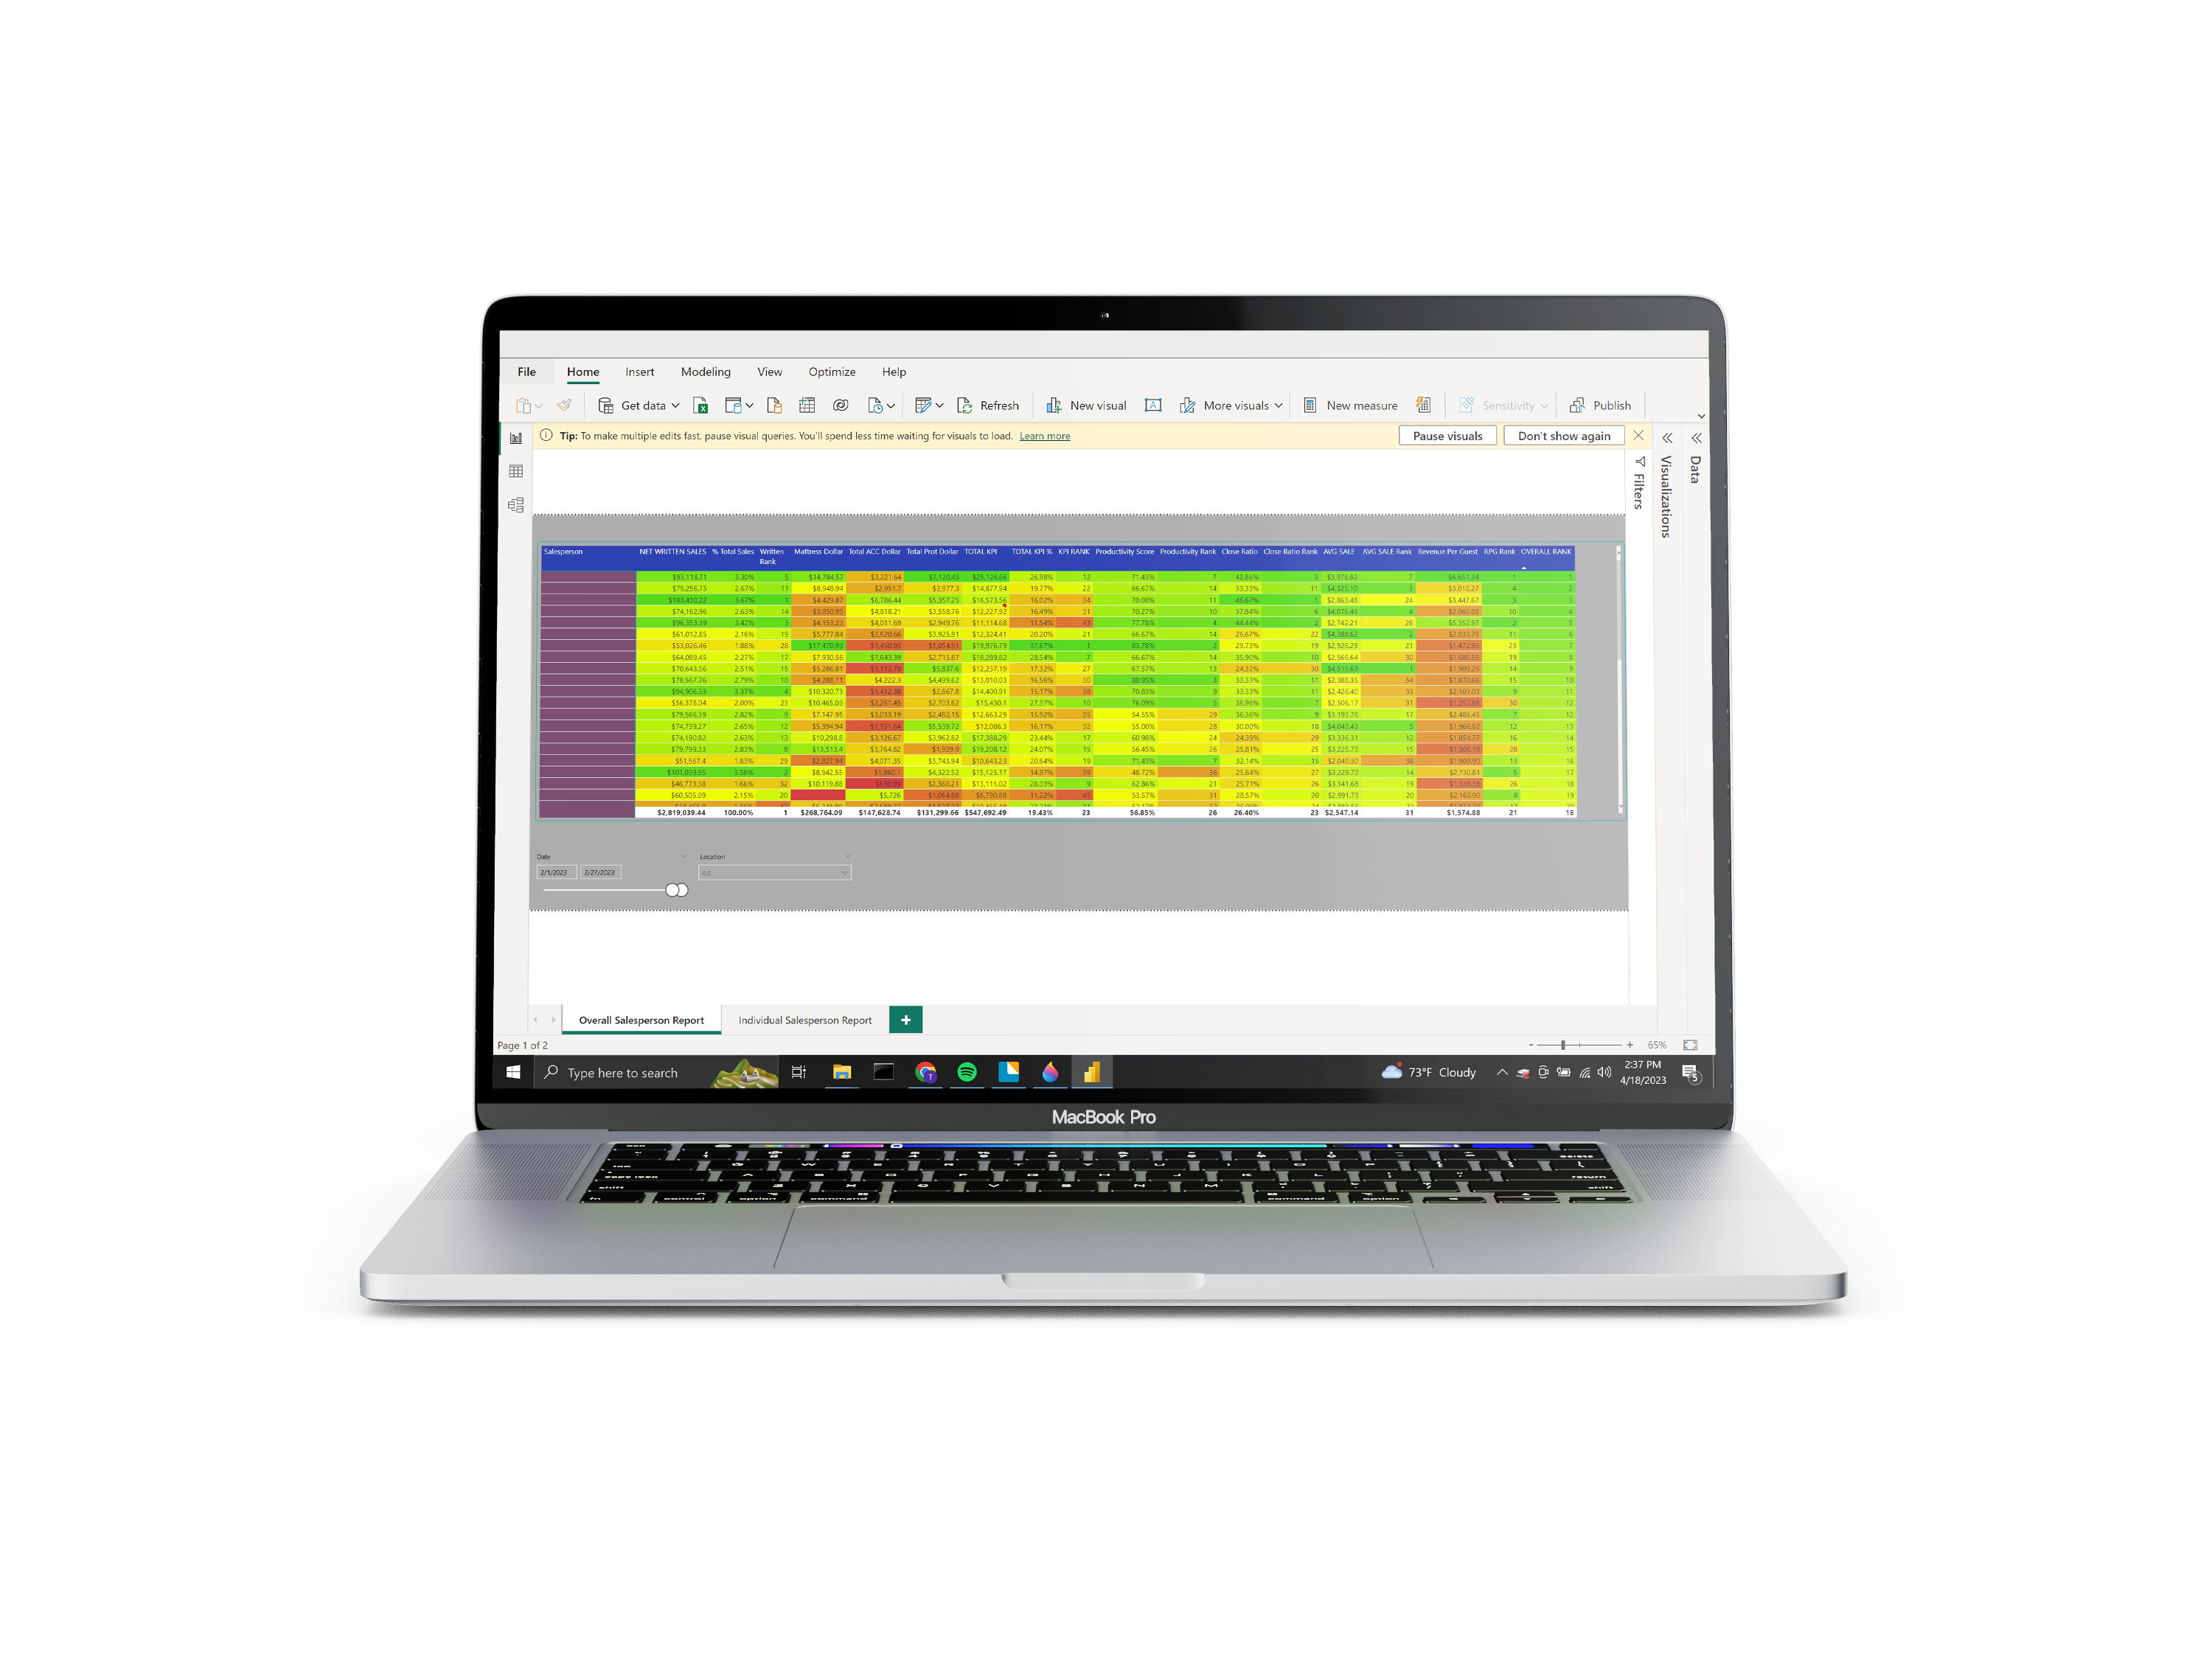
Salesperson Report Card
Measure sales numbers, KPIs, and rank your salespeople’s performance based off of tailor-made metrics.
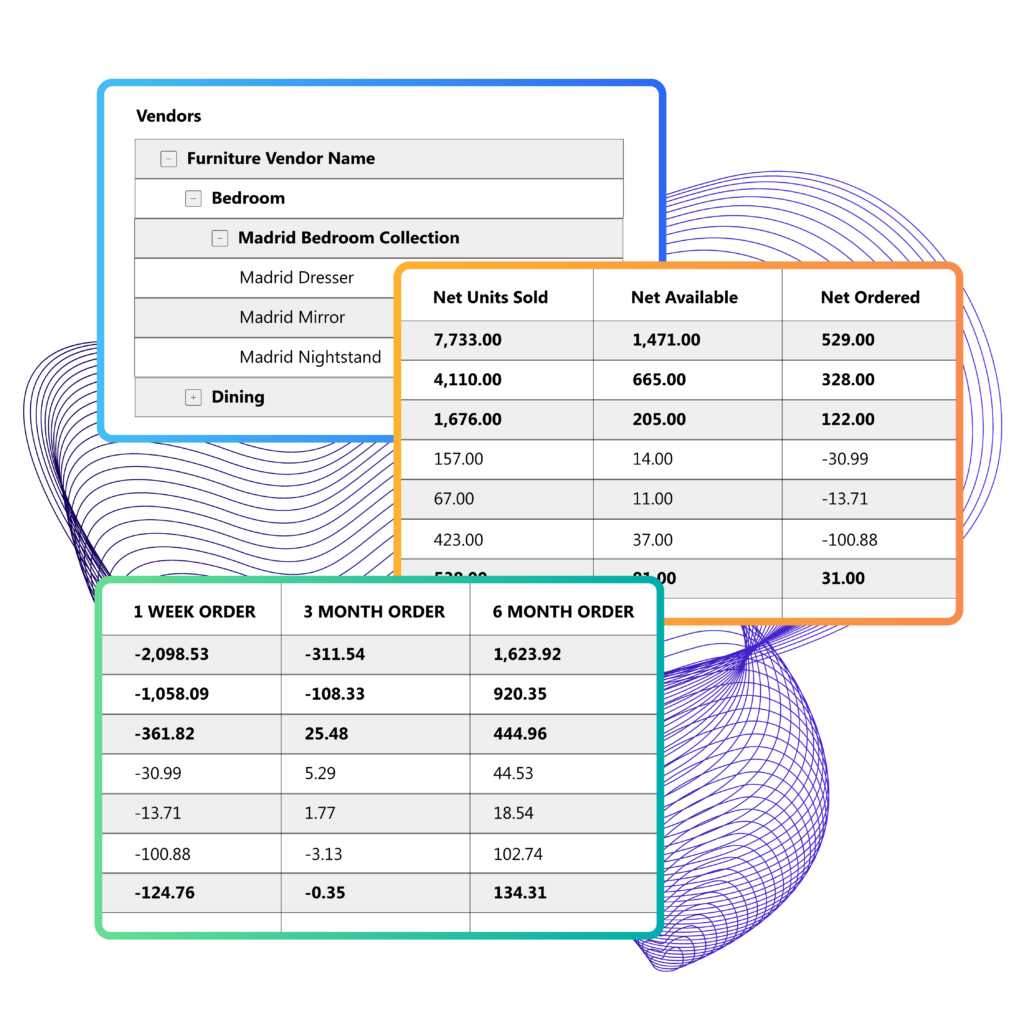
Ordering Tool
Manage inventory levels with a tool that calculates the quantity of units that you need to order to meet demand.
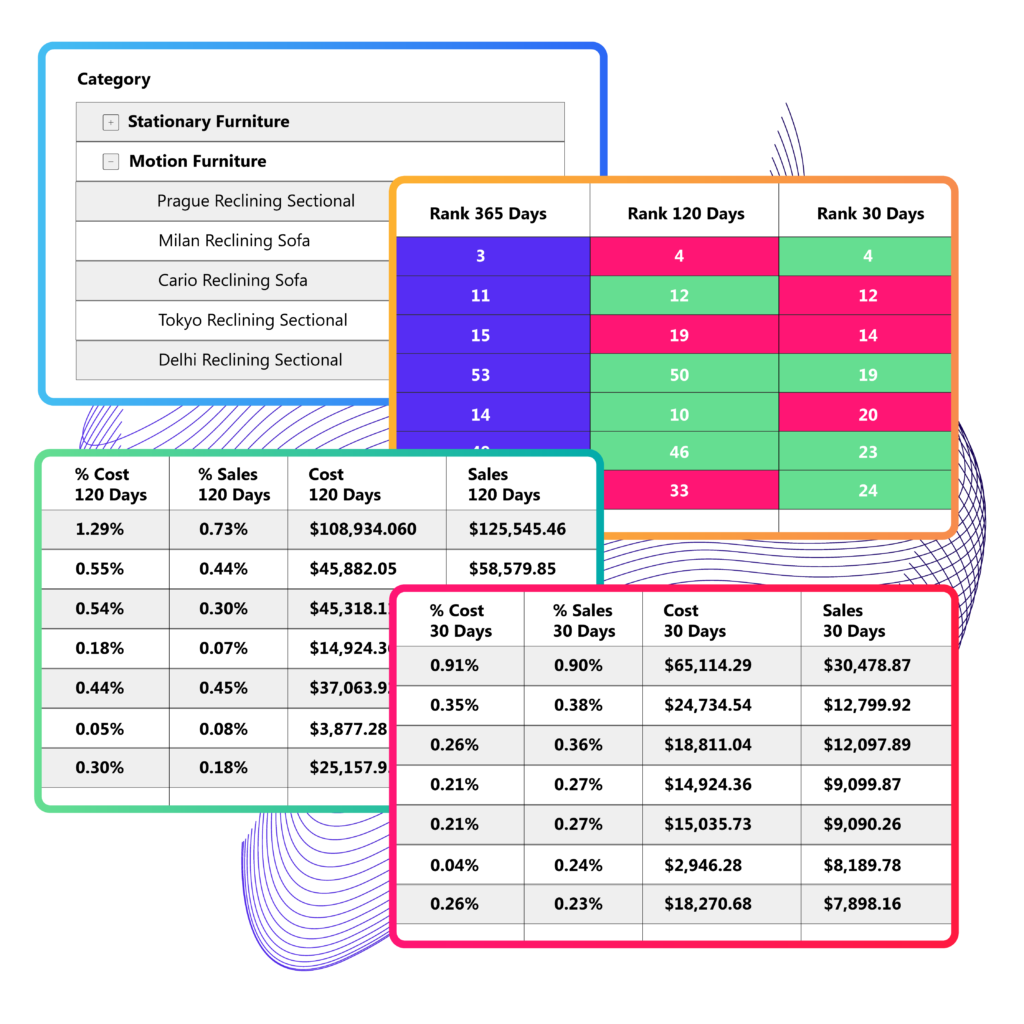
Velocity Report
View upwards and downwards trends in product, percent of inventory and percent of sales to manage inventory for your top-sellers, bottom performers and everything in between.

Salesperson & Store Report Cards
The Salesperson and Store Report Cards provide un-biased perspectives on the performance of your salesforce and stores. You decide what’s important to you, and we’ll measure it. These are your go to tools to measure the sales health of your company and staff.
Features
- Date Range: You decide what time frame you want to look at. The data will follow.
- Location Dropdown: View your entire salesforce, a few stores, or just one.
- Category and KPI Percentage Calculation: Measure KPI and category percentages in relation to overall sales.

Ordering Tool
Gauge current and project future inventory levels with this all-in-one tool.
Features
- Vendor -> Category -> Group -> Product Drill Down
- Net Units Sold 365 Days
- Net Available
- Net On Purchase Order
- 1 Week – 6 Month Recommended Order: The Units Sold, Net Available and Net PO numbers are used to calculate the amount of product needed to last you.

Velocity Report
Highlight your best sellers, up-and-comings, and under-performers by tracking trends across time.
Features
- Category -> Group -> Product Drill Down
- Net Sales Ranking at 365, 120, 60 and 30 Days
- 120 and 30 Day Average Inventory Levels
- 120 and 30 Day Sales
- By comparing Average Inventory Levels and Sales, you’re able to gain another layer of insight as to why a product may be over or under performing.
